A Small Business Analytics Guide for Better Decisions

When a business owner opens five screens to figure out how many leads came in, what the source of the latest sale was, and what the status of open proposals is, the problem is not a lack of data. The problem is the absence of a system that translates business activity into decisions. A small business analytics guide should start exactly here: not with choosing a flashy tool, but with a clear definition of what the business needs to know in order to manage growth, sales, and operations in a controlled way.
A small business usually has no BI department, no full-time analyst, and no time to invest in reports nobody reads. That is why analytics must be focused. It needs to give quick answers to the questions managers actually ask: what's working, what's stuck, where are leads being lost, which services are more profitable, and what action is needed right now.
Analytics Is Not a Dashboard - It's a Management Infrastructure
A beautiful dashboard can create a sense of control, but a sense of control is not control. If lead data lives in one system, proposals are sent from another tool, revenue is recorded in a manual file, and advertising expenses are checked separately, the business has no single reliable picture. It holds a collection of numbers that don't necessarily connect.
Good business analytics connects three layers. The first layer is activity: inquiries, meetings, proposals, tasks, campaigns, and service requests. The second layer is outcome: closed deals, revenue, gross profit, response time, and renewal rate. The third layer is decision: increasing investment in a particular channel, improving a sales process, shortening inquiry handling time, or stopping an activity that doesn't create value.
This connection is especially important for service-based businesses. A large number of leads is not valuable in itself. A quality lead that received a fast response, went through qualification, received a proposal, and was managed consistently can become revenue. A lead that is left without an owner, without a status, and without follow-up is mostly noise in a report.
A Small Business Analytics Guide Starts with Questions, Not Metrics
Before defining KPIs, it's worth determining which decisions the business wants to make based on the data. A business trying to grow sales will need different measurement than one trying to reduce operational load or improve profitability. There's no point in measuring dozens of parameters just because the system can display them.
You can start with five management questions. How much demand comes in each week, which sources bring quality demand, how much of it advances to a proposal and a sale, how long it takes to complete the process, and where a consistent drop in performance occurs. Answers to these questions create a more effective foundation than dozens of charts of views, clicks, or email opens.
The metrics themselves need to be defined in a uniform business language. For example, what counts as a lead? Does every form on the website qualify, or only an inquiry that meets threshold conditions? What counts as a closed deal? Is it a signature, a first payment, or the completion of an onboarding process? Without such definitions, two team members can look at the same report and reach different conclusions.
The Metrics That Reveal the Growth Engine
A small business doesn't need to measure everything. It needs to measure what reveals movement along the revenue process. In most businesses, an initial control panel will include at least the following metrics:
- Number of new leads by source, service, or campaign.
- Average response time to a new inquiry.
- Conversion rate from lead to meeting, from proposal to deal, and from deal to active customer.
- Average deal value and total revenue by period.
- Customer acquisition cost, where marketing and sales costs can be attributed.
- Cancellation, renewal, or repeat purchase rate, depending on the business model.
Every metric has context. For example, an increase in the number of leads is not necessarily a success if the close rate dropped because of low inquiry quality. Likewise, a decrease in the number of leads can be a positive outcome if the business moved to a channel that brings fewer inquiries but larger and more profitable deals.
It's worth separating outcome metrics from action metrics. Revenue is an outcome metric, but it often reflects activity that took place weeks or months earlier. Lead response time, the number of meetings scheduled, or the rate of proposals sent on time are action metrics. They make it possible to identify a problem before it turns into damage to revenue.
Build One Funnel from Inquiry to Payment
The most common mistake is to measure marketing, sales, and service as separate units. In practice, the customer doesn't experience the business that way. They leave their details, wait for a response, talk to a representative, receive a proposal, decide whether to buy, and expect to receive the promised service. Analytics needs to track this path end to end.
Start by defining fixed funnel stages: new lead, lead in process, qualification call, proposal sent, negotiation, deal closed, or deal not closed. In a business with an ongoing service, you can add onboarding, active customer, renewal, and churned customer stages. The key is that each stage represents a real state, and every team member updates it the same way.
This is where automation makes measurement more reliable. When a new form creates a lead in the system, assigns an owner, records the source, and triggers a reminder if no contact was made within a defined period, the business doesn't just improve service. It also prevents gaps in the data. A manual process depends on memory and discipline; an automated process records the action as part of the work itself.
The Data Source Matters as Much as the Report
Data whose origin is unclear, whose last update is unknown, and whose owner is unidentified is not a basis for a decision. Many small businesses rely on spreadsheets, email inboxes, advertising platforms, WhatsApp messages, and accounting software. Each tool has value, but without a synchronization and definition process, duplicates, conflicting statuses, and gaps between sales and financial reports emerge.
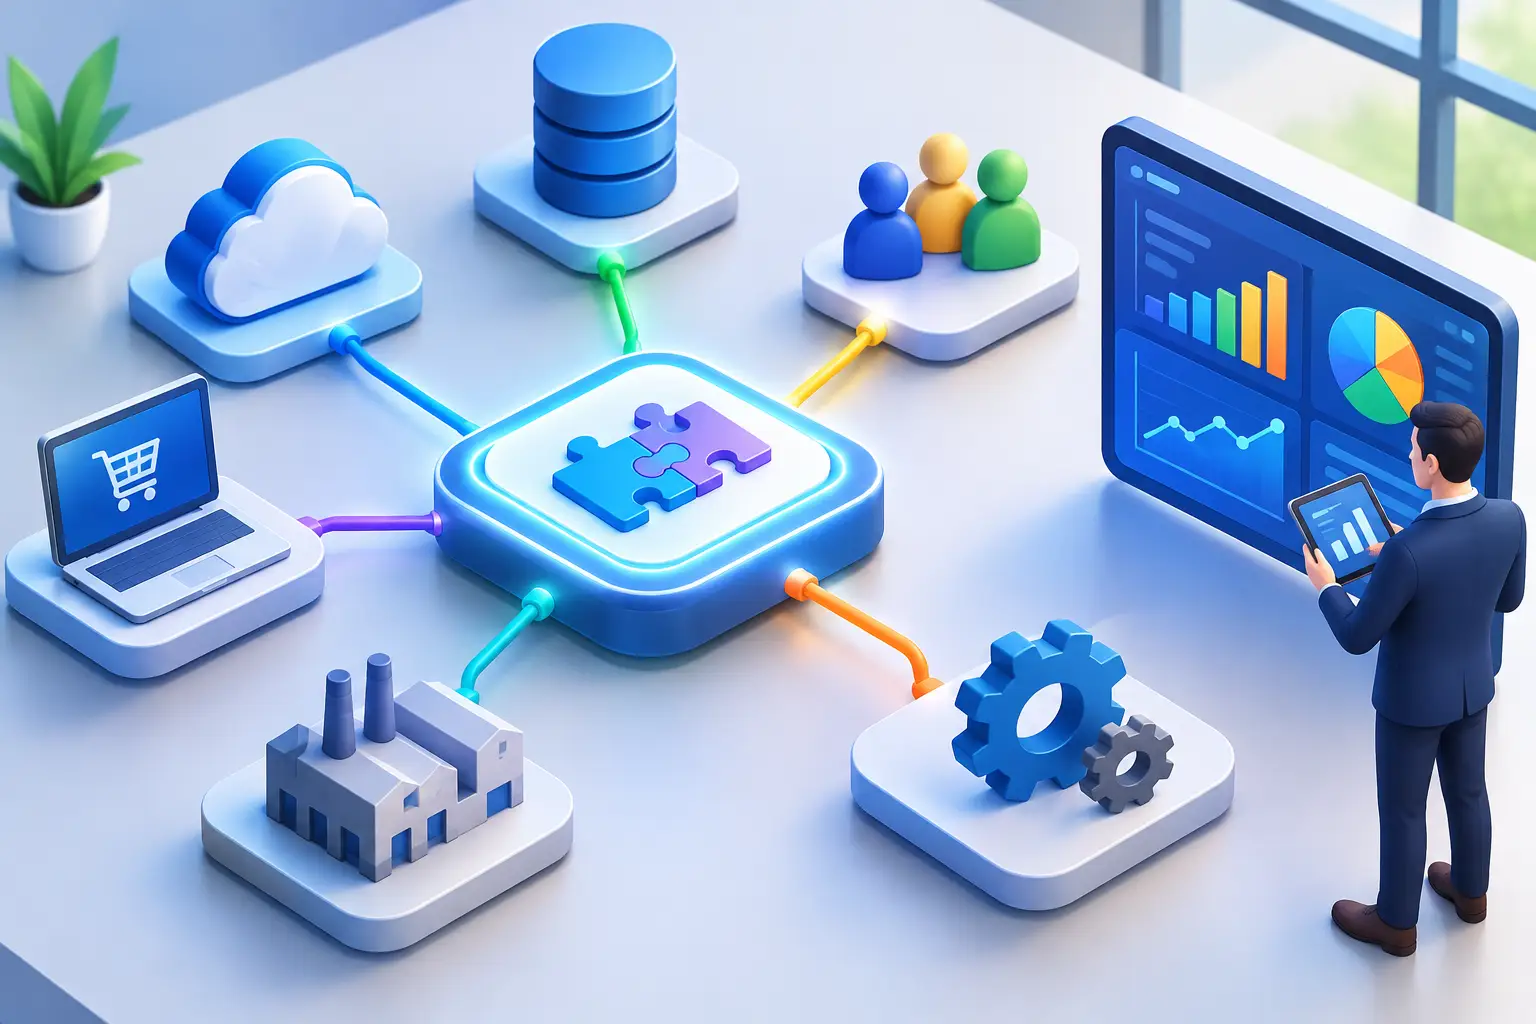
The goal is not necessarily to replace every system. Sometimes it's right to keep existing tools and connect them through an infrastructure that centralizes the important data. The decision depends on activity volume, business complexity, and maintenance costs. A business with dozens of inquiries a month can start with a simple structure; a business with several salespeople, multiple services, and variable advertising budgets usually needs tighter integration.
It's also important to define data ownership. Who checks that new leads were assigned a source? Who confirms that a deal was moved to closed status? Who handles duplicates? Analytics is not a one-time setup project. It's an operational discipline that requires simple rules, accountability, and ongoing validation.
How to Turn Data into a Management Routine
A report that isn't connected to a working meeting doesn't change behavior. To get value from analytics, you need to set a review cadence that suits the business. An active sales team can review new leads, open tasks, and unanswered inquiries every morning. Once a week it's worth checking the funnel, lead sources, stalled deals, and goals versus actuals. Once a month you can analyze profitability, trends, and acquisition costs.
In every review, the goal is not just to ask "what happened" but "what will we do about it." If response time went up, you need to check whether leads are missing owners, whether alerts aren't working, or whether there's overload at certain hours. If the rate of proposals that turn into sales is low, the problem may be in pricing, messaging, the quality of qualification, or follow-up after the proposal is sent. The data points in a direction, but it doesn't replace examining the process.
Be careful about drawing conclusions from a small sample. A single large deal can significantly change the month's numbers in a small business, and a new campaign sometimes needs time to produce a reliable picture. It's right to compare periods, examine trends, and not change strategy because of a one-time fluctuation. On the other hand, service and response-time problems require immediate attention even if there isn't yet enough "perfect" data.
Mistakes That Weaken Measurement
The first mistake is chasing vanity metrics, such as impressions or followers, without checking their connection to revenue and quality demand. They can be relevant for brand awareness, but they aren't sufficient for managing performance. The second mistake is measuring only the end of the process - monthly revenue - without understanding what happens in the stages leading up to it.
Another mistake is building an overloaded dashboard. A manager needs to spot an anomaly within minutes, not hunt for it among twenty charts. It's better to have a short screen that presents a snapshot, with the ability to drill down when a problem is discovered. Finally, there's no value in data that is updated only at the end of the month if operational decisions are made daily.
A good analytics system shouldn't make the business more bureaucratic. It should reduce repeated questions, shorten the search for information, and create clear accountability for every stage. When every lead, proposal, and task is documented within one process, you can see not only how much the business sold, but what will allow it to sell better next month.
The right step is to choose one high-impact process - for example, lead handling or proposal follow-up - and make it measurable, uniform, and as automated as possible. Once the data starts to reflect reality, decisions become less based on gut feeling and more based on control.